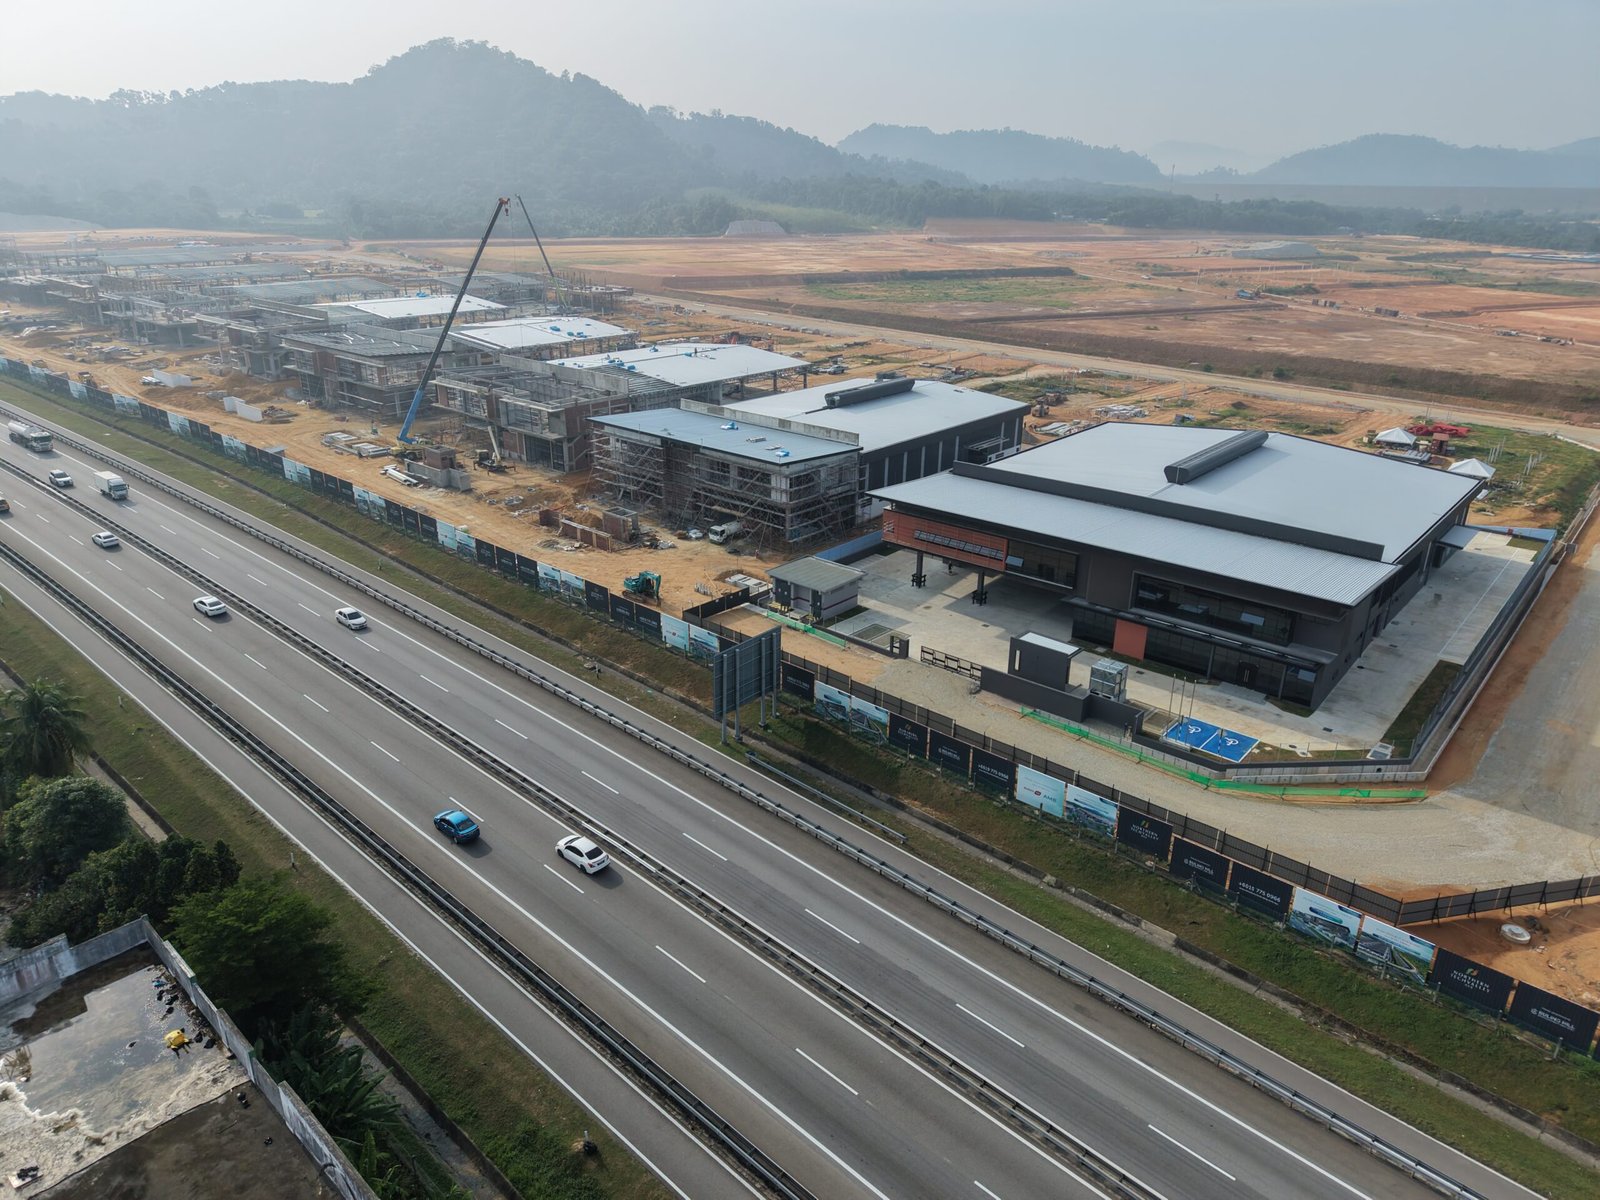
When businesses compare industrial locations, they often start with a simple question: “How far is the factory from the port?”
Distance matters, but for manufacturers, exporters, freight forwarders and logistics operators, consistency can matter even more. A route that is 18 minutes on paper but regularly becomes 40 minutes during working hours can create more operational friction than a slightly longer route with predictable travel times.
That is why Propmula studied the route between Northern TechValley @ BKE and Penang Port over seven consecutive days, covering every hourly time slot from midnight to 11:00 p.m. The purpose was not to produce a one-off “best-case” journey time. It was to understand how the route behaves across different days and traffic conditions.
Across 168 hourly observations, the average travel time from Northern TechValley to Penang Port was 19.9 minutes. The return journey averaged 20.7 minutes. Even the most congested observed outbound period remained at 22.1 minutes.
Why Port Connectivity Matters for an Industrial Location
Penang Port is not simply another destination on a map. The North Butterworth Container Terminal is one of Penang’s key container-handling facilities, serving import, export, storage, delivery and intermodal logistics activities. For companies that depend on container movements, the reliability of the road connection to the port can influence scheduling, driver utilisation, delivery buffers and the amount of operational uncertainty built into each trip.
Northern TechValley’s location strategy is built around access to the Butterworth–Kulim Expressway and the broader northern industrial network. But rather than relying only on a stated distance to the port, this study asks a more practical question:
Study Methodology
The study covers 19 July to 25 July 2026. For the Northern TechValley–Penang Port route, travel-time observations were recorded across 24 hourly periods per day for 7 days, producing 168 observations in each direction.
This article isolates the Penang Port route from a broader Propmula location study that also examined other major destinations. The figures should be read as a route consistency study, not as a guaranteed travel time for every future trip.
Finding 1: The Average Journey Stayed Close to 20 Minutes
Across the full seven-day sample, the average outbound journey from Northern TechValley to Penang Port was 19.9 minutes. The average return journey was slightly longer at 20.7 minutes.
That difference matters. It suggests the return direction was somewhat more exposed to traffic variation, but the overall gap remained small. The average round trip across all time periods was approximately 40.6 minutes.
Across all 168 hourly observations.
Return traffic showed a wider peak spread.
Finding 2: The Route Was Relatively Stable Across the Week
The daily averages did not swing dramatically from one day to another. The lowest average round-trip day in the sample was Sunday at about 39.3 minutes, while the highest daily average was Friday at about 41.2 minutes.
Weekday traffic was only modestly slower than the weekend sample. The weekday average round trip was 40.9 minutes, compared with 39.9 minutes on Saturday and Sunday combined.
| Day | Outbound Avg. | Return Avg. | Round Trip Avg. |
|---|---|---|---|
| Sunday2026-07-19 | 19.3 min | 20.0 min | 39.3 min |
| Monday2026-07-20 | 20.0 min | 20.8 min | 40.7 min |
| Tuesday2026-07-21 | 20.1 min | 20.8 min | 40.9 min |
| Wednesday2026-07-22 | 20.0 min | 21.0 min | 41.0 min |
| Thursday2026-07-23 | 20.0 min | 20.9 min | 40.9 min |
| Friday2026-07-24 | 20.1 min | 21.1 min | 41.2 min |
| Saturday2026-07-25 | 19.8 min | 20.7 min | 40.5 min |
Finding 3: Friday at 6:00 PM Was the Strongest Stress Test
The most congested observed time in the seven-day dataset was Friday, 24 July 2026 at 6:00 p.m. At that point, the outbound journey measured 22.1 minutes, the return journey measured 25.3 minutes, and the combined round trip was approximately 47.4 minutes.
What stands out is not simply that Friday evening was slower. The more useful observation is the size of the increase. Compared with the overall outbound average of 19.9 minutes, the worst outbound observation added only about 2.2 minutes. The return leg was more sensitive, adding about 4.6 minutes compared with its average.
The route did experience a clear evening peak, but the observed travel time did not multiply dramatically during the study period. For logistics planning, that distinction can be more useful than simply knowing the shortest possible journey time.
Finding 4: The Return Journey Was Slightly Less Predictable
The outbound journey had an average of 19.9 minutes and a standard deviation of roughly 1.1 minutes. The return journey averaged 20.7 minutes with a slightly wider variation of about 1.3 minutes.
Another way to view this is through the 90th percentile. Around 90% of outbound observations were at or below approximately 21.2 minutes, while 90% of return observations were at or below approximately 22.2 minutes.
For a business, this kind of information can help create more realistic logistics buffers. Instead of planning every trip around the fastest observed time, operators can use a more conservative threshold when scheduling port-related movements.
Why This Matters for Manufacturers and Logistics Operators
For an industrial buyer, a “good location” should not be reduced to a highway name or a kilometre figure. The real question is whether the location supports the daily operating model of the business.
1. More Predictable Delivery Planning
When travel times remain within a relatively narrow band, planners can estimate departure windows with more confidence and reduce unnecessary buffer time.
2. Better Driver and Vehicle Utilisation
A predictable port route can make it easier to plan multiple movements, shift changes and loading schedules. The benefit is not only time saved; it is the ability to plan with less uncertainty.
3. Lower Exposure to Daily Traffic Volatility
A route that regularly changes from 20 minutes to 50 minutes creates a very different operating environment from a route that remains within a narrower range. This seven-day sample suggests the Northern TechValley–Penang Port corridor was comparatively stable during the study window.
4. Location Can Support the Supply Chain — But It Is Not the Whole Decision
Port access is only one part of factory selection. Power supply, loading bays, floor loading, road geometry, container movement, labour access, supplier proximity, expansion space and the building specification still need to match the company’s operation.

What This Study Does — and Does Not — Prove
The study is useful because it looks beyond a single route screenshot. However, it should not be treated as a guarantee that every future journey will take the same amount of time.
- The observation window covers seven days, not every seasonal traffic condition.
- Accidents, roadworks, weather, public holidays and unusual congestion can materially change travel time.
- Heavy vehicles may experience different journey times from standard route estimates.
- Port gate waiting time, customs processes, loading and unloading are not included in the road travel-time figure.
- Future road changes may improve or worsen the route.
Northern TechValley’s official materials also highlight its planned direct flyover connection to the Butterworth–Kulim Expressway. If access arrangements change as the project develops, future route performance should be re-tested rather than assumed to remain identical.
Propmula View: The Important Number Is Not the Fastest Time
The shortest observed outbound journey in this seven-day sample was approximately 17.4 minutes.
But that is not the number we consider most useful.
For an industrial operator, the more meaningful result is that the route averaged about 19.9 minutes outbound, approximately 20.7 minutes on the return, and the strongest observed Friday evening stress test remained at about 22.1 minutes outbound.
That is the difference between looking at a map and studying how a location actually works.
Final Takeaway
During this seven-day study, Northern TechValley @ BKE showed a relatively consistent road connection to Penang Port. The average outbound journey was just under 20 minutes, while the return journey averaged slightly above 20 minutes. Even during the most congested observed period — Friday at 6:00 p.m. — the outbound journey remained around 22 minutes.
For manufacturers, exporters and logistics-related companies, that stability may be more valuable than a marketing claim about distance alone.
But industrial property decisions should never be made on one location metric. The port route should be evaluated together with factory specifications, power requirements, loading operations, labour access, suppliers, customers and future expansion needs.
At Propmula, that is how we approach industrial location analysis:
Location + Data. Better Property Decisions.
- Propmula 7-day hourly travel-time dataset, Northern TechValley @ BKE → Penang Port, 19–25 July 2026. 168 hourly observations in each direction.
- Northern TechValley @ BKE project details — location and connectivity information.
- Penang Port Commission — North Butterworth Container Terminal and port operations information.
Disclaimer: This article is for property research and educational purposes. Travel times are observations from a limited study window and are not guaranteed future journey times. Industrial suitability depends on business-specific operational requirements.